
A new sensor detail page, more room for the map and internally hosted plugins
Version 0.8.0 rebuilds the detail page of a sensor so that key figures, location and measurement profile sit side by side. The sensor list separates prepared from activated devices, the map uses the full screen on phones, and plugins can use the camera and Bluetooth, appear in the navigation and can be embedded even when their view is only reachable internally. With large data sets, lists and the map respond considerably faster.

Cedrik Hoffmann
Lead Developer & Project Lead
Version 0.8.0 is mostly about working with sensors and using the application on the go. The detail page of a sensor has been rebuilt, and the sensor list separates devices still waiting to be installed from those already in service. On phones the map gets considerably more room. Plugins gain access to the camera and Bluetooth and a fixed place in the navigation, and their view can now also come from a service that only runs internally. Alongside this, the backend has been sped up for large data sets.
Release Highlight
The detail page of a sensor
The detail page of a sensor now follows the layout of the irrigation group dashboard. The header shows a photo of the sensor model, the ID with the connection state, and the model and sensor type. Below it, four key figures sum up the current state: status, battery level, last signal and, for LoRaWAN sensors, reception, rated as good, fair or weak.
On wide screens the page splits into two columns. The left one holds the histories, the right one shows where the sensor sits and what it measures. The new location section places the sensor on a small map among the surrounding trees, followed by the irrigation group with its status and number of trees, and finally the tree the sensor is attached to. Both rows link to their detail pages. The measurement profile is a narrow depth section showing what the sensor records at which depth. Its dots use the same colour as the curve for that depth in the measurement chart, so profile and chart can be matched at a glance.
On tablets and phones the sections stack, with the location directly after the measurement chart. The small map no longer pans there when you swipe across the page.
The data quality notice takes up a single line as long as nothing is pending. When implausible readings exist, the list of affected values can be expanded. It shows the newest five first, and Show all opens the complete list. The signal history only appears when there are readings, and it no longer offers an all-time window, which had loaded and drawn thousands of individual points.
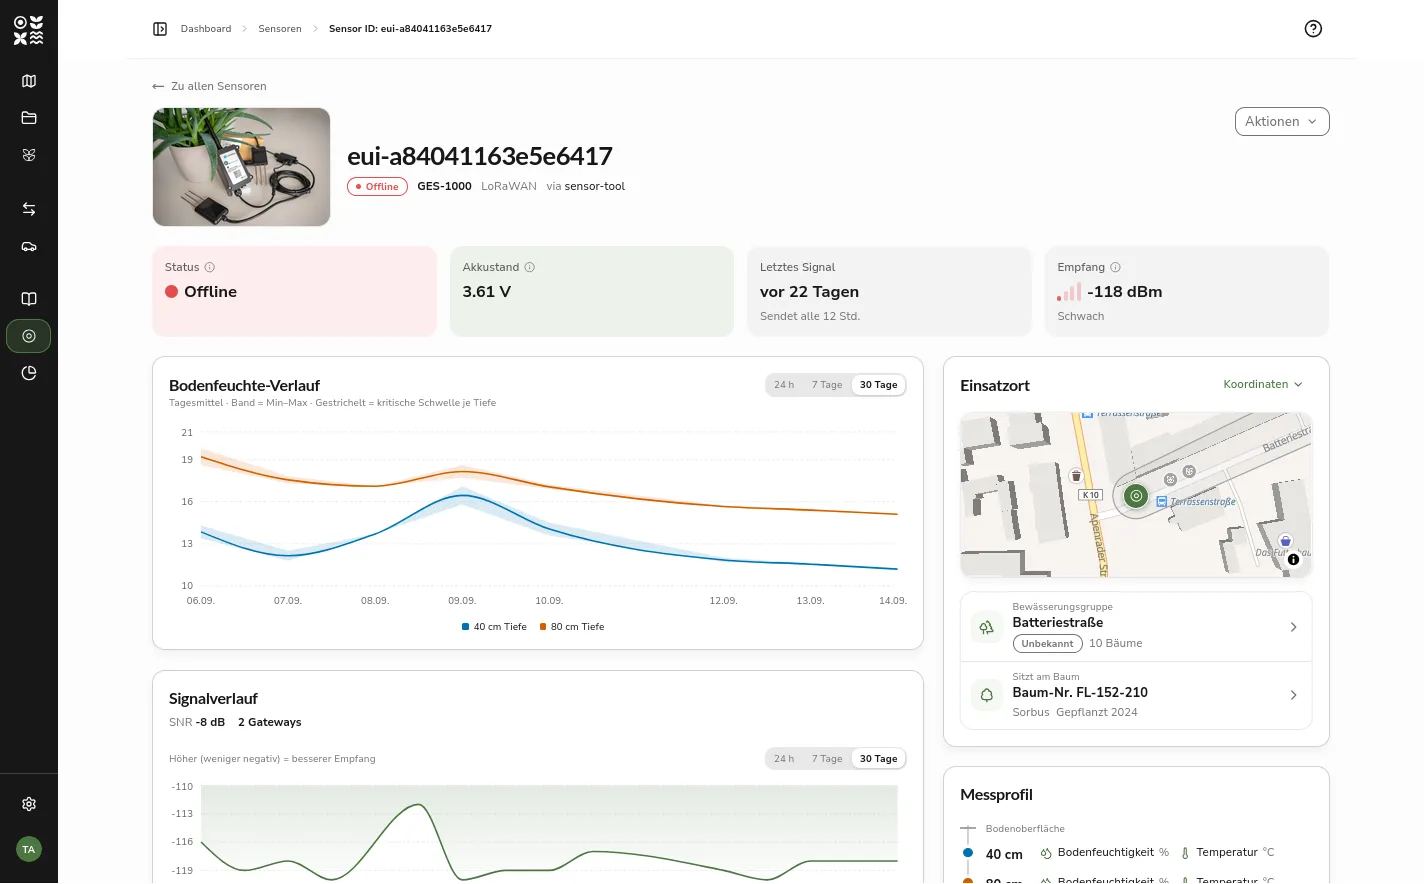 The detail page of a LoRaWAN sensor with the model photo, the four key figures, the soil moisture history and the location with map, irrigation group and tree
New Features
Prepared sensors in a tab of their own
The sensor list splits devices across two tabs. Activated is selected on opening and shows the sensors already in service, whether online or offline. Prepared collects the devices that have been created but not yet activated. Each tab shows how many sensors it holds, so it is clear without switching whether devices are still waiting to be installed.
The Prepared tab keeps only search, the model filter and sorting, since a device that has not been activated has neither readings nor a linked tree. The search term is kept when switching tabs. Existing links that filter on the prepared status lead straight to the new tab.
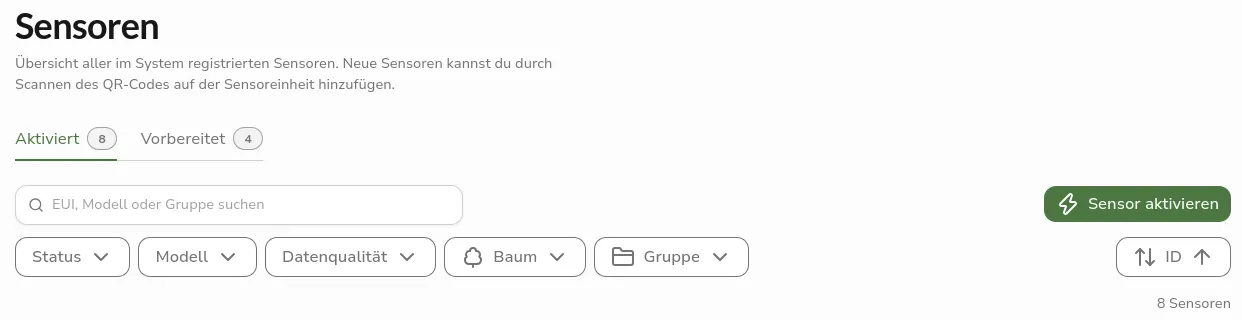 The sensor list with the Activated and Prepared tabs, each showing the number of sensors it holds
More room for the map on phones
On narrow screens, search and filters now float above the map instead of taking space away from it, and the map fills the remaining area completely. In Safari on iOS it extends behind the floating address bar, with the controls at the bottom lifted above it. As an installed app, Green Ecolution uses the full screen while keeping clear of the areas the device itself occupies, such as the camera or the gesture bar.
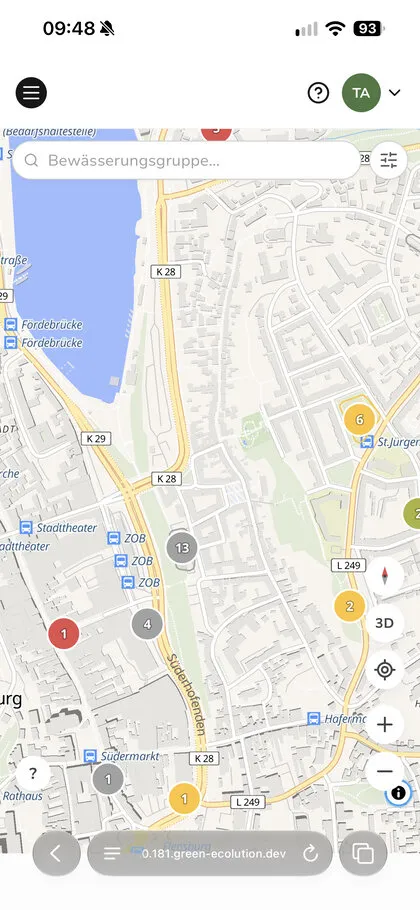 The map in Safari on an iPhone, with the search field above the map and the map extending behind the address bar
On Android and in the installed app the map page could also be scrolled a little, because it was taller than the visible area. It is now limited to the actual screen height.
Plugins with device access
Plugins with a view of their own now appear in the Plugins section of the sidebar for everyone allowed to open them. No permission to manage plugins is needed for that. Until now a plugin view could only be reached through its address, which had to be passed on to the people concerned after installation. If no access permission is set for a view, any permission in the plugin’s organization or above is enough. People from other organizations do not see it.
During installation, and later on the plugin’s detail page, its view can be granted access to the camera and Bluetooth. The grant does not replace the browser’s own prompt: the view can only use these functions once the person agrees there.
Each time it is opened, the view receives a single-use view ticket. Through it, the plugin’s backend can learn who opened the view, namely the person’s identifier and name, without gaining access to their credentials. Plugins can also create prepared sensors through the import interface, not just trees.
Plugin views from the internal network
Until now a plugin’s view had to live at a publicly reachable address. The third mode announced in the outlook of 0.7.0 can now be selected: alongside No view and Externally hosted, installation offers Internal (proxied). All it needs is the service name and port, for example kataster.plugins.svc.cluster.local:8080. Green Ecolution then serves the view under an address of its own, so the service itself does not have to be reachable from the internet.
On every request Green Ecolution checks whether the person may open the view. If the required permissions are revoked or the plugin is disabled, access ends with the next request. In this mode the plugin receives the person’s identifier and name directly from Green Ecolution with every request, so the detour through the view ticket is no longer needed. Here, too, the person’s credentials never reach the plugin.
Which services may be proxied is set by whoever runs the instance, in its configuration. A service outside this list is refused on saving, and the form states the reason. Each plugin appears under a subdomain of its own, for example kataster.plugins.example.org, which has to belong to the same domain as the application. If the proxy is not set up on an installation, the mode can still be selected, but saving fails with a corresponding notice.
Further Improvements
Faster with large data sets
For this release the backend was measured against a test data set of 500,000 trees and 14.6 million readings. Several queries scanned whole tables, among them the radius search, the free-text search and the soil moisture histories. New indexes and reworked queries fix this. The list of irrigation groups, for example, now takes 9 instead of 831 milliseconds on the largest test data set.
The outlines of the irrigation groups on the map used to be computed from every tree on each request, which took around one second at 500,000 trees. They are now stored and recomputed whenever the trees of a group change.
Lists respond faster on small data sets as well. The database compiled some queries before running them, which took longer than the query itself, so the sensor list needed more than 100 milliseconds with only ten sensors. This compilation is now switched off for the application.
Anyone running an instance with a very large number of trees should allow some time for the new indexes to be created during the update. On the test data set it took around 16 seconds.
Switching language from the user menu
The switch between German and English used to sit only at the bottom of the profile page, where it was stretched to full width. It is now also part of the user menu, which opens from your initials at the foot of the sidebar, and can therefore be reached from every page. On the profile page it has a section of its own.
Fixed Bugs
Irrigation schedules
The vehicle select in the irrigation schedule form offered a no vehicle option, although an irrigation schedule always needs a vehicle and saving failed in that case. The select now lists only existing vehicles. If the field is left empty, the form points this out.
Map
In the map panel of an irrigation group, the soil temperature read No data when the sensors transmit their readings in the newer, generic format. The temperature is now read from both formats.
On phones, the expanded drawer at the bottom of the map covered the open navigation menu. The menu now sits above it, including while it closes.
Outlook
Two of the points named in the outlook of 0.7.0 are still pending: the English translation of the handbook and sharing individual resources with sub-organizations.
Feedback and bug reports are always welcome on GitHub.
Found an error or have feedback on this release? Create an issue →