
95 millimetres of rain, and the soil stays dry
At one test site in Flensburg the soil grew drier for six weeks even though 95 millimetres of rain fell at the weather station. A full summer with nine soil sensors shows how little a rainfall reading says about the root zone.

Cedrik Hoffmann
Lead Developer & Project Lead
8 minutes read
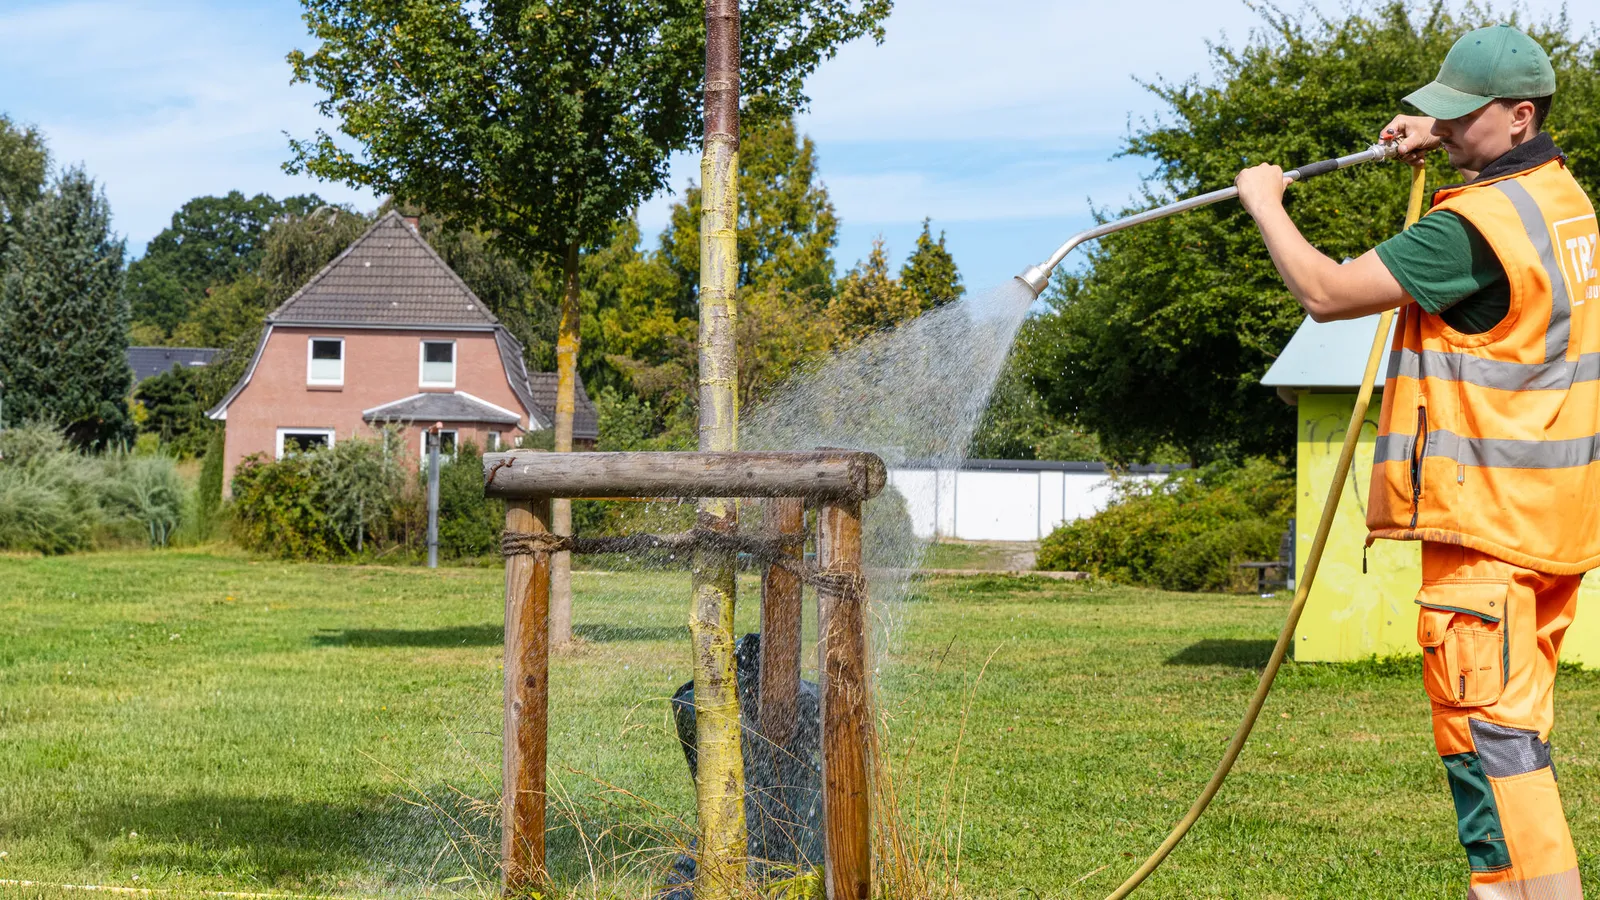
A Sorbus stands on Unterer Lautrupweg in Fruerlund, planted in 2024. From 5 June to 19 July the soil at its roots grew a little drier every day. Over the same six weeks the nearest weather station recorded 95.4 millimetres of rain.
The first sensors went into the ground in late May. Since then nine sites across Flensburg have delivered 19,441 measurements, from 29 May to 14 September. The Sorbus is one of them.
Reported rainfall against water that arrives
The soil on Unterer Lautrupweg is slightly silty sand. On 5 June the soil moisture at 40 centimetres depth sits at 17.5 percent by volume. From there it falls, day after day, down to 8.1 percent by 19 July. Of the 95.4 millimetres at the DWD station at Glücksburg-Meierwik, 29 fell on a single day, 27 June. At 40 centimetres depth none of it shows up. The curve does not even kink that day.
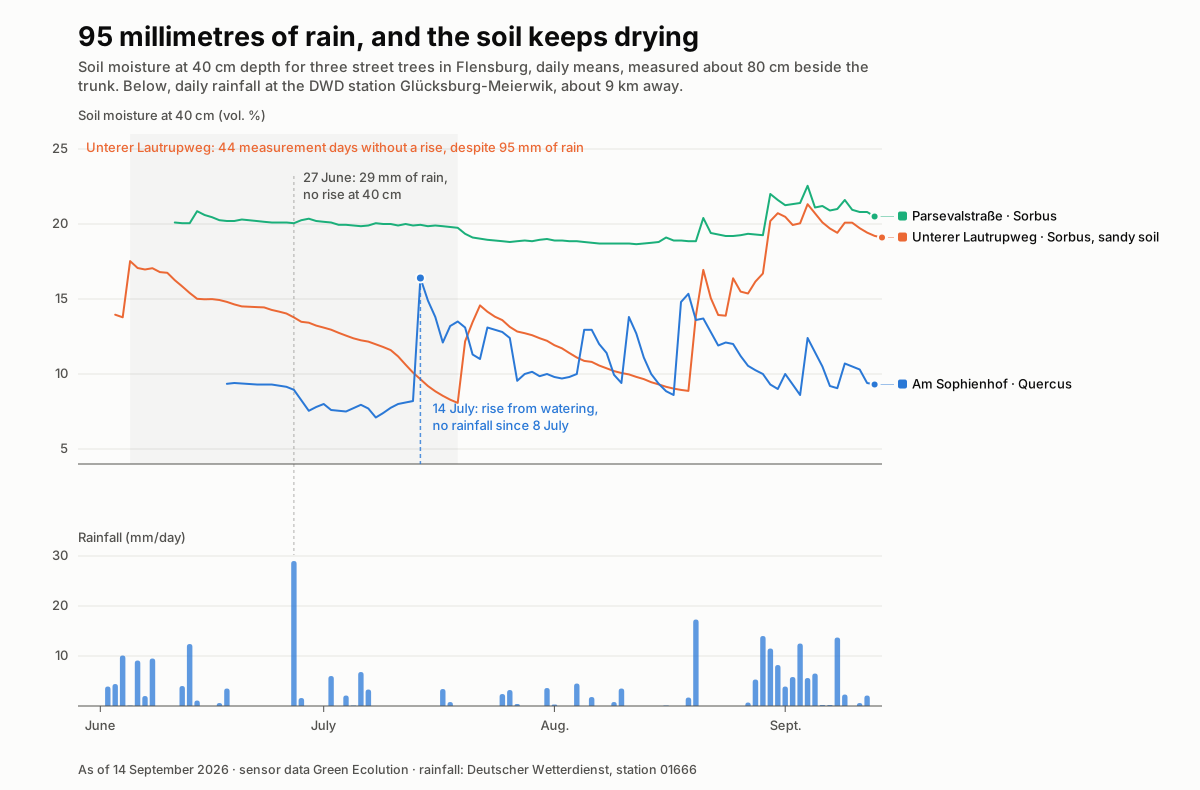 Above, soil moisture at 40 cm depth for three street trees in Flensburg from June to September; below, daily rainfall at the DWD station as bars. The curve for Unterer Lautrupweg falls continuously until mid-July even though several rain days are recorded over the same period.
Rain falls across the whole area, not on a single point. What arrives at one measuring point therefore holds roughly for the soil around it, which makes a weather reading and a soil reading directly comparable. The station reported 95 millimetres. At root depth, nothing is measurable.
Summer rain lands on dried-out, partly sealed urban soil and spreads across the surface. The canopy catches part of it, which evaporates from the leaves and never reaches the ground at all. More of what does land evaporates before it works its way down. The amount of rain reported therefore says nothing about how much water reaches the root zone.
By now the Sorbus shows green. Since 20 August around 110 millimetres have fallen at the station, spread over many days rather than a few downpours. At 40 centimetres it has been steady between 19 and 20 percent ever since.
A few kilometres away, under the same weather, a second Sorbus stands on Parsevalstraße. There the moisture stays between 18.6 and 22.6 percent all summer. Under the same weather report, more than ten percentage points separate the two trees.
Six sites, one weather situation
A single site can be a fluke. We therefore put every site with a continuous series up against the summer’s rain events, six of them, spread across the city and across five soil types.
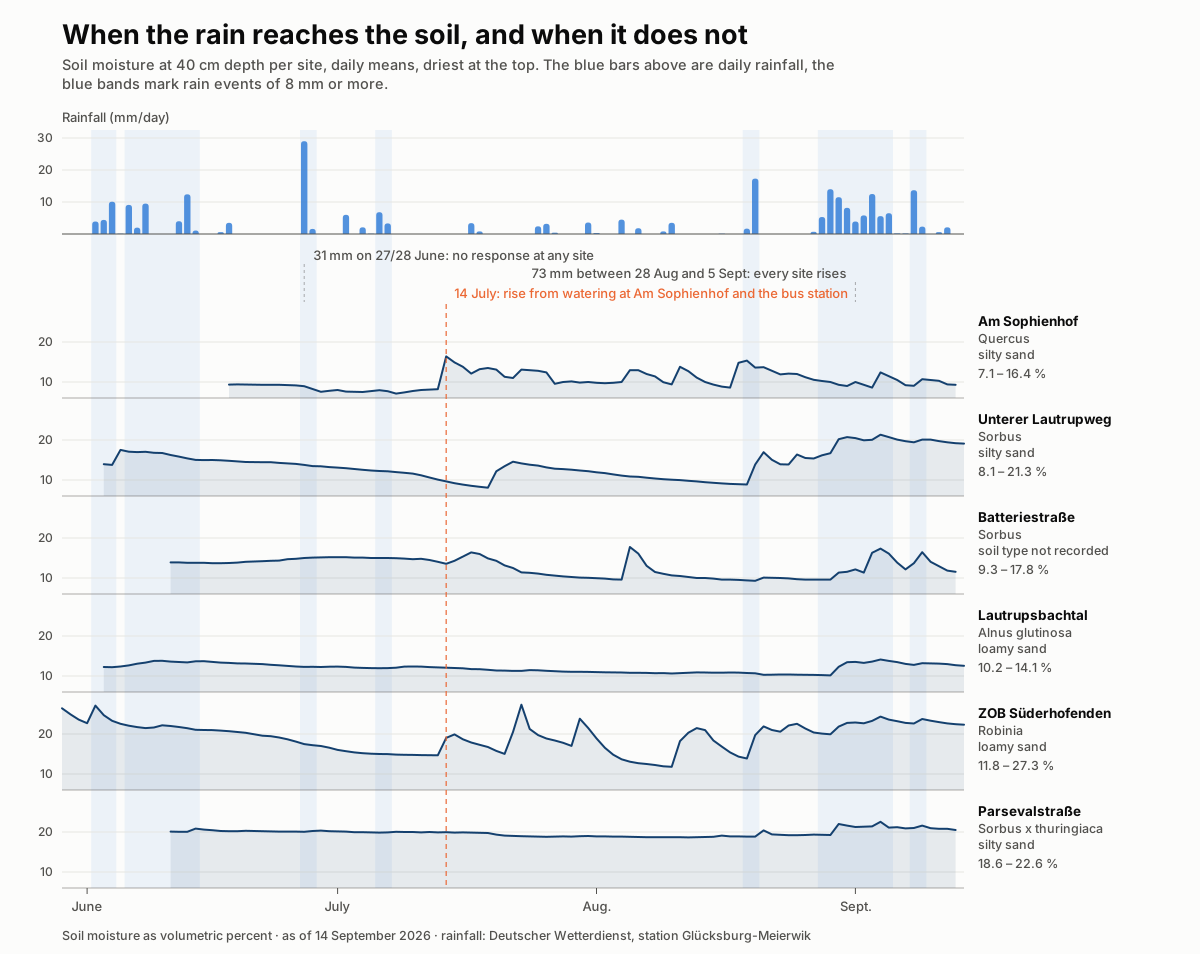 Six charts stacked vertically, one per site, showing soil moisture at 40 cm depth from June to September. Above them, daily rainfall as bars. Vertical blue bands mark the rain events. During the June and July events all six curves stay flat; during the long spell of rain in late August and early September all of them rise. A dashed line marks 14 July, where the curve for Am Sophienhof jumps from watering while the one for Unterer Lautrupweg keeps falling unchanged.
On 27 and 28 June, 31 millimetres fell, 29 of them in a single day. At none of the six sites does that register at 40 centimetres depth; the swings range from −0.6 to +0.4 percentage points, which is noise. The same goes for the event on 6 and 7 July with 10 millimetres, nowhere more than half a percentage point.
On 19 and 20 August, 19 millimetres fell. This time the responses diverge sharply. Unterer Lautrupweg gains 8.0 percentage points, the Süderhofenden bus station 7.6, Parsevalstraße 1.5, Batteriestraße and Am Sophienhof 0.6, Lautrupsbachtal nothing at all. Under the same weather and the same 19 millimetres, the effect at 40 centimetres depth runs from eight percentage points down to zero. The Cercis on Klaus-Groth-Straße would come in at 12.7 percentage points, but it transmits too irregularly for this comparison and therefore appears in neither the chart nor the event table.
Between 28 August and 5 September 73 millimetres fell, spread across nine days. There all six sites rise, by between 1.8 and 7.8 percentage points. What arrives below therefore depends less on the amount reported than on how it is spread over time. Heavy rain on dried-out soil runs off the surface, while the same total spread over a week works its way down. Lower evaporation in late summer probably contributes, though our data cannot quantify that share.
When watering reaches the soil
From 8 to 16 July the weather station reported not a single millimetre on any day, the longest dry spell of the summer. On 14 July the soil moisture nonetheless rises sharply at two sites. At Am Sophienhof it climbs from 8.2 to 16.4 percent at 40 centimetres and from 18.9 to 21.3 at 80 centimetres. At the Süderhofenden bus station it gains 4.3 percentage points at 40 and 7.3 at 80 centimetres.
On that very day the TBZ, the city’s technical operations centre, watered at Am Sophienhof and at the Süderhofenden bus station. That gives us a watering run documented by date, site and depth. We now know what watering looks like in the curve. The soil moisture jumps within a single day at both depths, while the rain gauge stays at zero.
The same pattern turns up again on 20, 22 and 30 July, each at one or two sites. Which run is behind each of them can so far only be settled with a log of the watering trips. Whether water arrived is already in the curve today. In future the TBZ will manage its watering runs through Green Ecolution. The run and the reading will then sit side by side.
Water applied directly to the tree pit reaches depth. Rain spread across dry urban soil often does not.
Dry on top, moist below
Every sensor measures at two depths, 40 and 80 centimetres. At the oak at Am Sophienhof the two values stay far apart all summer.
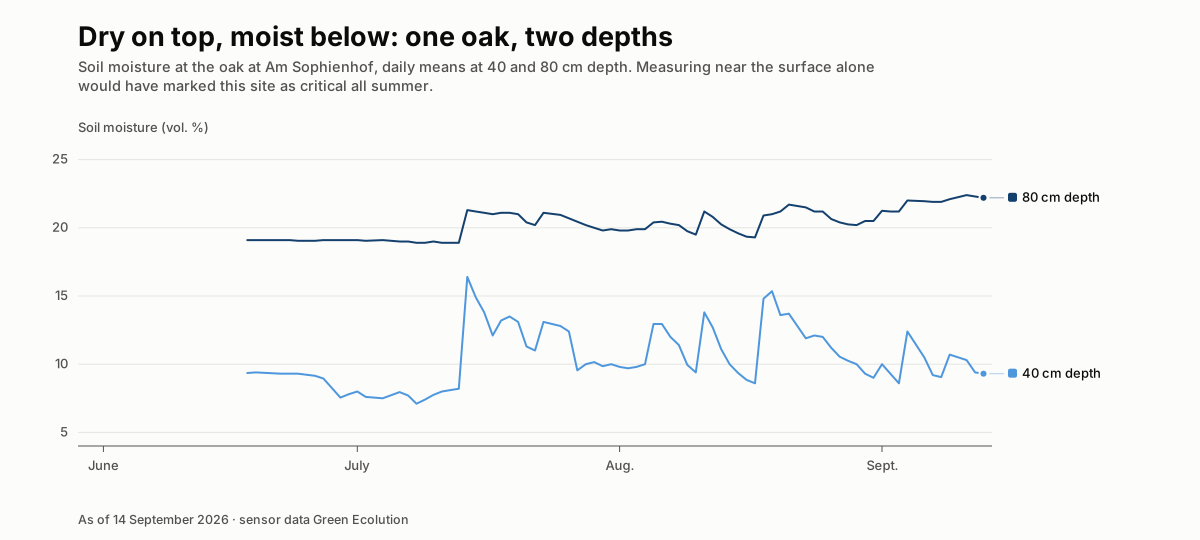 Soil moisture at the oak at Am Sophienhof at 40 and 80 cm depth from June to September. The 80 cm curve holds steady at around 20 percent while the 40 cm curve swings below it, between 7 and 16 percent.
At 40 centimetres the site drops to 7.1 percent and stays in single digits for weeks. At 80 centimetres it sits at a steady 19 to 22 percent over the same period. A reading at 40 centimetres alone would have marked this tree as dry all summer and sent watering runs to it, even though water was available at 80 centimetres throughout.
Nine sites, three different summers
What an urban tree needs is not in the weather report. That holds in both directions. A day of rain does not mean water arrives below. A dry one does not mean none is there. Thirty-one millimetres over two days moved nothing at any of the six sites. The 19 millimetres in August lifted one site by eight percentage points and the next not at all.
Under the same weather, one site was well supplied all summer. A second was dry on top and moist below. A third spent six weeks heading downwards. A watering plan drawn up without measurement would have treated all three alike.
One summer is not enough for statements spanning years, so we keep measuring.
About the data
The readings come from the Green Ecolution database as of 14 September 2026. The sensors record soil moisture and soil temperature at 40 and 80 centimetres depth plus battery voltage. They transmit over LoRaWAN. All moisture values are volumetric percentages. Where the text refers to daily values, it means daily means, which smooths the curves compared to individual readings. We excluded the probe’s error values.
At these test sites the sensor is about 80 centimetres from the trunk. The trees were already standing. A borehole right at the root ball would have damaged a young tree’s roots. For area-wide events such as rain that spot is representative. A watering run at the trunk does not necessarily reach it, so individual runs can be missing from the readings. For new plantings the sensor goes directly at the roots.
The rainfall figures are open daily values from Germany’s national meteorological service, the Deutscher Wetterdienst, station Glücksburg-Meierwik, identifier 01666, roughly nine kilometres east of the test sites. It is the nearest active precipitation station. The series is available from the DWD Climate Data Center, with the daily total in the RS column. On three days of our comparison period the station reported no value, on 9, 16 and 19 June. The 95.4 millimetres are therefore a lower bound. Summer showers are highly local, so an individual daily total at a tree in Flensburg can differ from the station. That does not matter for a statement covering six weeks, but it does matter for attributing single days.
The jump in the 80-centimetre value on Unterer Lautrupweg from 20 to over 40 percent on 20 and 21 August is strikingly high. It may be genuine recharge, but it may also be that water runs down the backfilled borehole faster than through the undisturbed soil around it. Such edge effects of drilled installations are well known. We will check this before drawing any conclusion from that value.
| Site | Species | Soil | 40 cm (vol. %) | 80 cm (vol. %) |
|---|---|---|---|---|
| Am Sophienhof | Quercus | Su2 | 7.1 to 16.4 | 18.9 to 22.4 |
| Unterer Lautrupweg | Sorbus | Su3 | 8.1 to 21.3 | 19.9 to 42.1 |
| Klaus-Groth-Straße | Cercis | Su3 | 9.1 to 21.8 | 9.6 to 21.7 |
| Batteriestraße | Sorbus | not recorded | 9.3 to 17.8 | 12.3 to 33.4 |
| Lautrupsbachtal | Alnus glutinosa | Sl2 | 10.2 to 14.1 | 10.0 to 13.1 |
| Süderhofenden bus station | Robinia | Sl3 | 11.8 to 27.3 | 12.3 to 29.3 |
| Ringstraße | Quercus | Sl2 | 14.6 to 19.7 | 14.4 to 21.1 |
| Petrischule | Carpinus | Sl3 | 15.1 to 17.9 | 17.7 to 19.1 |
| Parsevalstraße | Sorbus x thuringiaca | Su4 | 18.6 to 22.6 | 18.8 to 23.5 |
Range of daily means per site and depth across the whole measurement period. The soil codes follow the German soil mapping standard. Su2 to Su4 are silty sands, Sl2 and Sl3 loamy sands. The sites on Ringstraße and at the Petrischule were only added in late August, so their ranges cover barely three weeks.
| Site | 27/28 June31 mm in 2 days | 6/7 July10 mm in 2 days | 19/20 Aug19 mm in 2 days | 28 Aug–5 Sept73 mm in 9 days |
|---|---|---|---|---|
| Am Sophienhof | −0.2 | +0.5 | +0.6 | +1.8 |
| Unterer Lautrupweg | −0.3 | −0.1 | +8.0 | +6.0 |
| Batteriestraße | +0.4 | 0.0 | +0.6 | +7.8 |
| Lautrupsbachtal | −0.1 | +0.4 | −0.1 | +3.8 |
| Süderhofenden bus station | −0.6 | −0.1 | +7.6 | +4.0 |
| Parsevalstraße | +0.2 | +0.2 | +1.5 | +3.2 |
Response of soil moisture at 40 centimetres depth to four rain events, in percentage points. Calculated as the highest daily mean between the start of the event and two days after it ends, minus the last daily mean before it. An event is a run of days with at least one millimetre each and at least eight millimetres in total. Values below half a percentage point are on the order of the daily fluctuation and cannot be told apart from zero.